
ABOUT GBC

Welcome to Great Basin College!
Great Basin College values you! Valuing what we have in common and our differences means we will foster a college climate of mutual trust, tolerance, informed discourse and always seek to promote GBC as a "safe space" to explore new ideas and perspectives with opportunities for you to grow, learn and be successful in a friendly, supportive campus environment. GBC enriches people's lives by providing student-centered, post-secondary education to rural Nevada. GBC students enjoy outstanding academic programs, smaller class sizes, and excellent faculty who really care about our students. We are GBC!
ADMISSIONS

ACADEMICS

For High School Students
STUDENT SERVICES

GBC ONLINE

Great Basin College is "The Gold Standard in the Silver State" when it comes to long-distance education and online education delivery. GBC offers hundreds of classes and a diverse array of certificate and degree programs fully online and fully affordable!
COMMUNITY
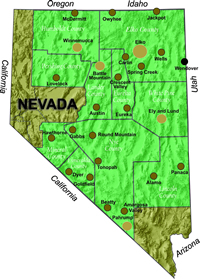
Great Basin College wants to be your choice for higher education. GBC offers associate and baccalaureate level instruction in career and technical education and academic areas. About 4,000 students are enrolled annually online from across the country and on campuses and centers across 86,500 square miles, two time zones, and ten of Nevada's largest counties. We border Arizona, Oregon, Idaho, Utah, and California. We are GBC!
INFORMATION

Need to find COVID-19 information quick? Check out our Coronavirus (COVID-19) Information and Resources page!

RESOURCES

Institutional Research Surveys
Welcome to the GBC Institutional Research Surveys page! Surveys such as graduate satisfaction, student satisfaction inventory, face 2 face vs. online class, survey of students in online classes, administer evaluation and the faculty and staff surveys. Select a year range to view survey documents.
- 2021-2022
- 2020-2021
- 2019-2020
- 2018-2019
- 2017-2018
- 2016-2017
- 2015-2016
- 2014-2015
- 2013-2014
- 2012-2013
- 2011-2012
- 2010-2011
- 2009-2010
- 2007-2008
Survey Results
2022 Campus Safety and Sexual Assult Survey
The Nevada Center for Surveys, Evaluation, and Statistics (CSES) conducted a web survey at Great Basin College to assess attitudes, perceptions, and experiences regarding sexual conduct and campus safety. Data collection took place in February and March 2022, followed by a second recruiting period in April 2022.
2021-2022 Graduate Survey
The 2021-2022 Graduate Survey results are reported below for all graduates together and by award level. Students graduated in 2021- 2022 and were surveyed in summer 2023 and asked to evaluate their satisfaction with their learning outcomes, GBC services, and their education. Graduates obtaining nursing, radiology, sonography, and ultrasound do not use this graduate survey. There were 452 graduates that were surveyed, and 117 graduates responded. This is a 26% response rate.
- GBC 2021-2022 Graduate Satisfaction Survey Report
- GBC 2021-2022 Graduate Employment Survey Report
- GBC 2021-2022 Graduate Satisfaction Survey Report with charts
- GBC 2021-2022 Graduate Survey Results by Award Level
- GBC 2021-2022 Graduate Satisfaction Survey Comments
2021 GBC COVID Survey Report
The 2021 Effects of COVID-19 Pandemic on College Students in Nevada survey results are reported below. GBC students were surveyed along with five other institutions in NSHE during February 2021. The survey focused on COVID-19 pandemic effects. Students were eligible to participate in the survey if they were 18 years or older. There were 2199 GBC students surveyed and 166 responded. This is a 8% response rate.
2020-2021 Graduate Survey
The 2020-2021 Graduate Survey results are reported below for all graduates together and by award level. Students graduated in 2020- 2021 and were surveyed in summer 2022 and asked to evaluate their satisfaction with their learning outcomes, GBC services, and their education. Graduates obtaining nursing, radiology, ultrasound, and education ARL’s degrees do not use this graduate survey. There were 446 graduates that were surveyed, and 144 graduates responded. This is a 32% response rate.
- GBC 2020-2021 Graduate Satisfaction Survey Report
- GBC 2020-2021 Graduate Employment Survey Report
- GBC 2020-2021 Graduate Satisfaction Survey Report with charts
- GBC 2020-2021 Graduate Survey Results by Award Level
- GBC 2020-2021 Graduate Satisfaction Survey Comments
2019-2020 Graduate Survey
The 2019-2020 Graduate Survey results are reported below for all graduates together and by award level. Students graduated in 2019- 2020 and were surveyed in summer 2021 and asked to evaluate their satisfaction with their learning outcomes, GBC services, and their education. Graduates obtaining nursing and radiology technology degrees do not use this graduate survey. There were 394 graduates that were surveyed, and 117 graduates responded. This is a 30% response rate.
- GBC 2019-2020 Graduate Satisfaction Survey Report
- GBC 2019-2020 Graduate Employment Survey Report
- GBC 2019-2020 Graduate Satisfaction Survey Report with charts
- GBC 2019-2020 Graduate Survey Results by Award Level
- GBC 2019-2020 Graduate Satisfaction Survey Comments
2018-2019 Graduate Survey
The 2018-2019 Graduate Survey results are reported below for all graduates together and by award level. Students graduated in 2018- 2019 and were surveyed in summer 2020 and asked to evaluate their satisfaction with their learning outcomes, GBC services, and their education. Graduates obtaining nursing and radiology technology degrees do not use this graduate survey. There were 392 graduates that were surveyed and 130 graduates responded. This is a 33% response rate.
- GBC 2018-2019 Graduate Satisfaction Survey Report
- GBC 2018-2019 Graduate Employment Survey Report
- GBC 2018-2019 Graduate Satisfaction Survey Report with charts
- GBC 2018-2019 Graduate Survey Results by Award Level
- GBC 2018-2019 Graduate Satisfaction Survey Comments
2017-2018 Graduate Survey
The 2017-2018 Graduate Survey results are reported below for all graduates together and by award level. Students graduated in 2017- 2018 and were surveyed in summer 2019 and asked to evaluate their satisfaction with their learning outcomes, GBC services, and their education. Graduates obtaining nursing and radiology technology degrees do not use this graduate survey. There were 363 graduates that were surveyed, and 130 graduates responded. This is a 36% response rate.
- GBC 2017-2018 Graduate Satisfaction Survey Report
- GBC 2017-2018 Graduate Employment Survey Report
- GBC 2017-2018 Graduate Satisfaction Survey Report with charts
- GBC 2017-2018 Graduate Survey Results by Award Level
- GBC 2017-2018 Graduate Satisfaction Survey Comments
Fall 2018 Student Satisfaction Inventory Survey
The Fall 2018 Student Satisfaction Inventory Survey results are reported below for GBC students overall and by primary location of enrollment. There were 3671 students surveyed and 347 responded. This is a 11% response rate.
- Noel-Levitz Report on Demographics and Overall SSI Results with National Comparisons
- Noel-Levitz Report comparing overall results for fall 2018 with fall 2016
- Noel-Levitz Report split out for Elko, Ely, Internet and Pahrump
- Noel-Levitz Report split out for Winnemucca and all Other locations
- Noel-Levitz Interpretive Guide on Satisfaction Priorities Surveys
- Noel-Levitz Comments
- Noel-Levitz-comparison group codes other undecided computer technologies
- Noel-Levitz comparison group codes human services
- Noel-Levitz comparison group codes other social science business education
- Noel-Levitz comparison group codes transfer radiology technology nursing
Spring 2017 Face 2 Face vs. Online Class Survey
The spring 2017 Face 2 Face vs. Online Class Survey results are reported below for GBC students. There were 3103 students surveyed and 482 responded. This is a 16% response rate.
2016-2017 Graduate Survey
The 2016-2017 Graduate Survey results are reported below for all graduates together and by award level. Students graduated in 2016- 2017 and were surveyed in summer 2018 and asked to evaluate their satisfaction with their learning outcomes, GBC services, and their education. Graduates obtaining nursing, radiology technology and education degrees do not use this graduate survey. There were 406 graduates that were surveyed and 135 graduates responded. This is a 33% response rate.
- GBC 2016-2017 Graduate Satisfaction Survey Report
- GBC 2016-2017 Graduate Employment Survey Report
- GBC 2016-2017 Graduate Satisfaction Survey Report with charts
- GBC 2016-2017 Graduate Survey Results by Award Level
- GBC 2016-2017 Graduate Satisfaction Survey Comments
Fall 2016 Student Satisfaction Inventory Survey
The Fall 2016 Student Satisfaction Inventory Survey results are reported below for GBC students overall and by primary location of enrollment. There were 3397 students surveyed and 700 responded. This is a 21% response rate.
- Noel-Levitz Report on Demographics and Overall SSI Results with National Comparisons
- Noel-Levitz Report comparing overall results for fall 2016 with spring 2014
- Noel-Levitz Report split out for Elko, Ely, Internet and Pahrump
- Noel-Levitz Report split out for Winnemucca and all Other locations
- Noel-Levitz Interpretive Guide on Satisfaction Priorities Surveys
- Noel-Levitz Comments
2015-2016 Graduate Survey
The 2015-2016 Graduate Survey results are reported below for all graduates together and by award level. Students graduated in 2015- 2016 and were surveyed in summer 2017 and asked to evaluate their satisfaction with their learning outcomes, GBC services, and their education. Graduates obtaining nursing, radiology technology and education degrees do not use this graduate survey. There were 391 graduates that were surveyed and 134 graduates responded. This is a 34% response rate.
- GBC 2015-2016 Graduate Satisfaction Survey Report
- GBC 2015-2016 Graduate Satisfaction Survey Report with charts
- GBC 2015-2016 Graduate Survey Results by Award Level
- GBC 2015-2016 Graduate Satisfaction Survey Comments
Spring 2015 Survey of Students in Online Classes
The Spring 2015 survey of students in online classes on satisfaction with student services and accessibility of student services
2014-2015 Graduate Survey
The 2014-2015 Graduate Survey results are reported below for all graduates together and by award level. Students graduated in 2014- 2015 and were surveyed in summer 2016 and asked to evaluate their satisfaction with their learning outcomes, GBC services, and their education. There were 367 graduates surveyed and 98 graduates responded. This is a 27% response rate
- GBC 2014-2015 Graduate Satisfaction Survey Report
- GBC 2014-2015 Graduate Satisfaction Survey Report with charts
- GBC 2014-2015 Graduate Survey Results by Award Level
- GBC 2014-2015 Graduate Satisfaction Survey Comments
Spring 2014 Student Satisfaction Inventory Survey
The Spring 2014 Student Satisfaction Inventory Survey results are reported below for GBC students overall and by primary location of enrollment. There were 2706 students survey and 500 responded. This is a 20% response rate.
- GBC Spring 2014 Summary Results
- Noel-Levitz Report on Demographics and Overall SSI Results with National Comparisons
- Noel-Levitz Report comparing overall results for spring 2014 with fall 2012
- Noel-Levitz Report split out for Elko, Ely, Internet and Pahrump
- Noel-Levitz Report split out for Winnemucca and all Other locations
- Noel-Levitz Interpretive Guide on Satisfaction Priorities Surveys
2013-2014 Graduate Survey
The 2013-2014 Graduate Survey results are reported below for all graduates together and by award level. Students graduated in 2013- 2014 and were surveyed in summer 2015 and asked to evaluate their satisfaction with their learning outcomes, GBC services, and their education. There were 410 graduates surveyed and 122 graduates responded. This is a 30% response rate.
- GBC 2013-2014 Graduate Satisfaction Survey Report
- GBC 2013-2014 Graduate Satisfaction Survey Report with charts
- GBC 2013-2014 Graduate Survey Results by Award Level
Spring 2013 Administrator Evaluation Survey
The Spring 2013 Administrator Evaluation Survey overview is provided below with general statistics on response rates. A blank survey instrument is included.
2012-2013 Graduate Survey
The 2012-2013 Graduate Survey results are reported below for all graduates together and by award level. Students were surveyed one year after graduating and asked to evaluate their satisfaction with their learning outcomes, GBC services, and their education. There were 318 graduates surveyed and 96 graduates responded. This is a 30% response rate.
- GBC 2012-2013 Graduate Satisfaction Survey Report
- GBC 2012-2013 Graduate Survey Results by Award Level
Fall 2012 Student Satisfaction Inventory Survey
The Fall 2012 Student Satisfaction Inventory Survey results are reported below for GBC students overall and by primary location of enrollment, including internet classes.
- GBC Fall 2012 Summary Results
- Noel-Levitz Report on Overall SSI Results with National Comparisons
- GBC SSI Results by Location
2011-2014 Graduate Survey on Program Learning Outcomes
The 2011-2014 Graduate Survey on Program Learning Outcomes rated satisfaction with program outcomes. Students graduated in 2011-2014 and were surveyed in spring 2016. Graduates were asked to rate the highest GBC degree/certificate awarded during that time period and could evaluate more than one degree or certificate. Graduates who received an AA or AS were not included in this survey since they are already asked to rate their growth in general education learning outcomes in the annual graduate survey. There were 493 graduates surveyed and 119 graduates responded. This is a 24% response rate. Although the overall response rate is 24%, the responses for individual degree programs can be quite small. Programs with fewer than 5 responses are not considered reliable.
- GBC 2016 Student Learning Outcome Survey
- GBC 2016 Student Learning Outcome Survey Employment Results
2011-12 Graduate Survey
The 2011-12 Graduate Survey results are reported below for all graduates together and by award level. Students were surveyed one year after graduating and asked to evaluate their satisfaction with their learning outcomes, GBC services, and their education.
Spring 2011 Student Satisfaction Survey
The Spring 2011 Student Satisfaction Survey results are summarized below and include recommendations. The actual questions and responses by category can be found below. Student suggestions for improvement have been edited to remove individual names.
- Survey Results Summary
- Recommendations for Changes Based on Results
- Overall Institutional Satisfaction Questions
- Academic Affairs Questions
- Student Services Questions
- Advising Questions
- Student Comments and Suggestions for Improvement
2010-11 Graduate Survey
The 2010-11 Graduate Survey results are reported below for all graduates together and by award level. Students were surveyed one year after graduating and asked to evaluate their satisfaction with their learning outcomes, GBC services, and their education.
2009-10 Graduate Survey
The 2009-10 Graduate Survey results are provided below by level of award.
2007 Faculty and Staff Survey
The 2007 Faculty and Staff Survey results are summarized below and include actions taken by GBC since then as well as recommendations. The actual questions and summarized responses by employee category are also below. The original, detailed report of results can be found on our Archived IR Site under Survey Reports.
For More Information Contact
Institutional Research and Effectiveness
Berg Hall Room 107
Great Basin College
1500 College Parkway
Elko, NV 89801
Why Great Basin College
Great Basin College wants to be your choice for higher education. GBC offers associate and baccalaureate level instruction in career and technical education and academic areas. About 4,000 students are enrolled annually online from across the country and on campuses and centers across 86,500 square miles, two time zones, and ten of Nevada's largest counties. We border Arizona, Oregon, Idaho, Utah, and California. We are GBC!

